cuSignal on the AIR-T
cuSignal is a GPU accelerated version of scipy.signal that is maintained by the NVIDIA RAPIDS team. The RAPIDS software suite is an open source API that provides users GPU accelerated data science tools. Deepwave Digital is a contributor to the open source toolbox and provides functionality to enable Jetson and the AIR-T.
cuSignal: source code
Create cuSignal Conda Environment
Anaconda is preinstalled with AirStack 0.4.0+ with a local Conda channel for the AIR-T radio drivers. This tutorial assumes you are running AirStack 0.4.0+.
1. Start by downloading the Conda environment's YAML file and creating the initial environment. Note that this can take quite a bit of time.
- For AirStack 0.5+:
wget docs.deepwavedigital.com/Open_Source/files/cusignal_airt.yml
conda env create -f cusignal_airt.yml
- For AirStack 0.4:
wget docs.deepwavedigital.com/Open_Source/files/cusignal_airt_v0.4.yml
conda env create -f cusignal_airt_v0.4.yml
2. Activate cuSignal Conda Environment
conda activate cusignal
3. Download cuSignal:
git clone https://github.com/rapidsai/cusignal.git
4. Install cuSignal
cd cusignal; ./build.sh
Now cuSignal should be installed on your AIR-T. You can test by running the code below.
Example: Polyphase Filter
The following Python code provides an example of how to use the AIR-T SoapySDR interface in conjunction with the resample_poly function of cuSignal. This is the source code to the Deep Learning and Signal Processing Webinar.
The following source code show how to execute the polyphase resampling filter on the AIR-T and measure the throughput datarate.
#!/usr/bin/env python3
import SoapySDR
from matplotlib import pyplot as plt
import cupy
import cusignal as signal
from cusignal import filter_design
buffer_size = 2**19 # Number of complex samples per transfer
t_test = 20 # Test time in seconds
freq = 1350e6 # Tune frequency in Hz
fs = 62.5e6 # Sample rate
# Create polyphase filter
fc = 1. / max(16, 25) # cutoff of FIR filter (rel. to Nyquist)
nc = 10 * max(16, 25) # reasonable cutoff for our sinc-like function
win = filter_design.fir_filter_design.firwin(2*nc+1, fc, window=('kaiser', 0.5))
win = cupy.asarray(win, dtype=cupy.float32)
# Init buffer and polyphase filter
buff = signal.get_shared_mem(buffer_size, dtype=cupy.complex64)
s = signal.resample_poly(buff, 16, 25, window=win)
# Initialize the AIR-T receiver using SoapyAIRT
sdr = SoapySDR.Device(dict(driver="SoapyAIRT")) # Create AIR-T instance
sdr.setSampleRate(SoapySDR.SOAPY_SDR_RX, 1, fs) # Set sample rate
sdr.setGainMode(SoapySDR.SOAPY_SDR_RX, 1, True) # Set the gain mode
sdr.setFrequency(SoapySDR.SOAPY_SDR_RX, 1, freq) # Tune the frequency
rx_stream = sdr.setupStream(SoapySDR.SOAPY_SDR_RX, SoapySDR.SOAPY_SDR_CF32, [1])
sdr.activateStream(rx_stream)
# Run test
n_reads = int(t_test * fs / buffer_size) + 1
for i in range(n_reads):
sr = sdr.readStream(rx_stream, [buff], buffer_size)
s = signal.resample_poly(buff, 16, 25, window=win)
sdr.deactivateStream(rx_stream)
sdr.closeStream(rx_stream)
gbps = n_reads * len(buff) * buff.itemsize * 8 / (2**30) / t_test
print('Data Rate = {:1.3f} Gbps on GPU'.format(gbps))
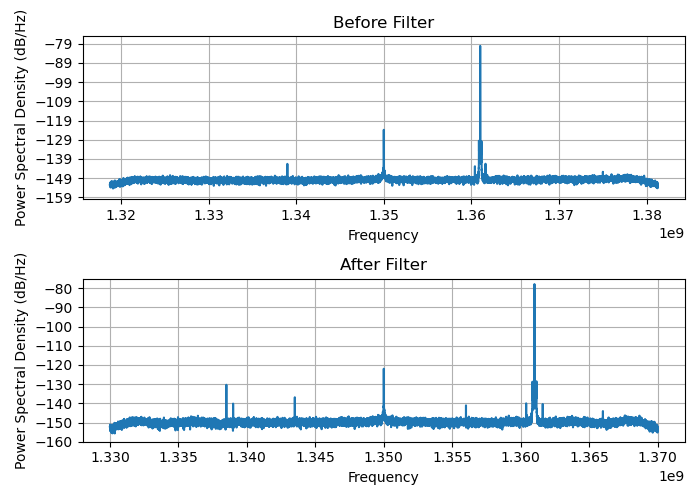
# Plot Power Spectral Density
plt.figure(figsize=(7, 5))
plt.subplot(211)
plt.psd(cupy.asnumpy(buff), Fs=fs, Fc=freq, NFFT=16384)
plt.ylim((-160, -75))
plt.subplot(212)
plt.psd(cupy.asnumpy(s), Fs=fs*16/25, Fc=freq, NFFT=16384)
plt.ylim((-160, -75))
plt.show()